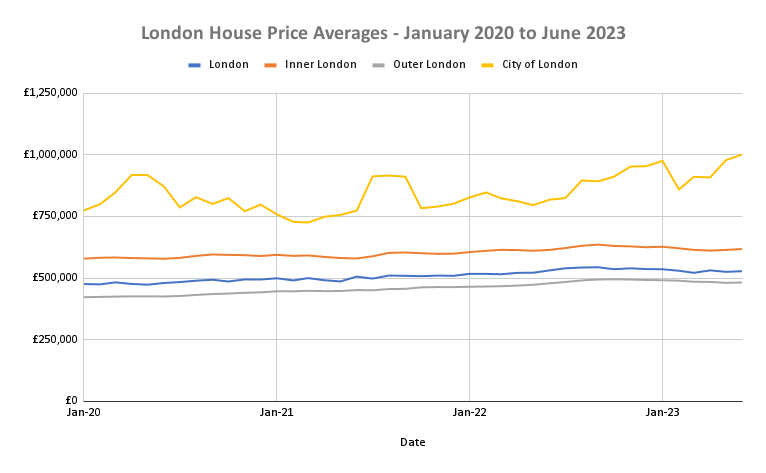
Recent data analysis sheds light on London’s housing market dynamics, revealing key insights into house price trends from 2020 onwards. The study compared price trajectories in Inner London, Outer London, and the City of London.

Key Findings
Steady Appreciation
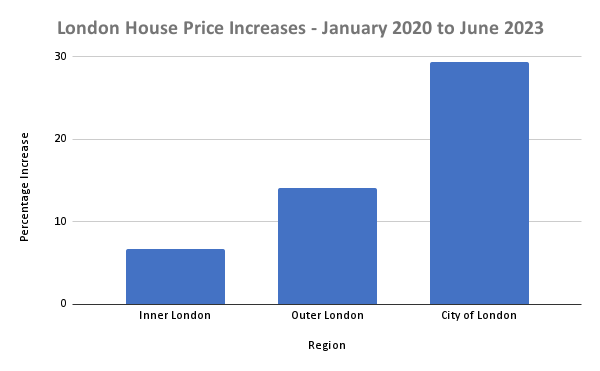
- Inner London witnessed an approximate increase of 6.78% in house prices since January 2020.
- Outer London saw a more pronounced appreciation with prices rising by about 14.11%.
- The City of London experienced the most significant surge, with house prices inflating by a staggering 29.42%.

Peak Prices
- Inner London: House prices peaked in September 2022.
- Outer London: The zenith was reached in October 2022.
- City of London: June 2023 saw the highest prices.
Price Lows
- Inner London hit its lowest in June 2020.
- Outer London saw its minimum prices in January 2020.
- The City of London experienced its lowest in March 2021.
Overall Averages
The average house price over the studied period was approximately £602,191.81 in Inner London, £459,113.88 in Outer London, and £845,964.40 in the City of London.
These trends highlight London’s robust property market, offering insights for homeowners, investors, and stakeholders in the real estate sector. While Inner and Outer London display steady growth, the City of London’s volatility presents both potential opportunities and challenges.
The data for this analysis was sourced from Land Registry records of house price data from January 2020 to June 2023 in the UK (the most recent available month at time of research.
